
The Q2 Infographic paints a picture filled with hope and resilience. But is that hope justified?
At DataJobs.nl, we love visualizing data. It helps guide the way in the world of data vacancies and data professionals. Three months ago, we released our very first DataJobs.nl Infographic: a unique visual overview of job openings for data specialists in the Netherlands.
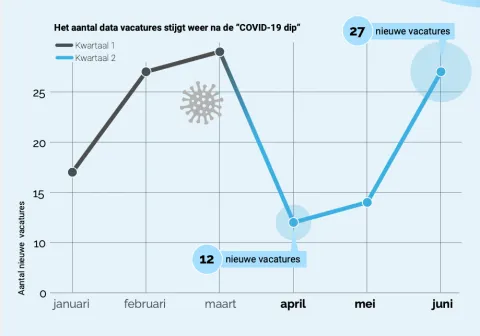
COVID-19
Three months ago, we predicted that the Q2 Infographic would look very different. Just weeks earlier, the so-called "intelligent lockdown" due to COVID-19 had come into effect in the Netherlands.
Our prediction was accurate. The Q2 Infographic (download the PDF via the link) indeed looks very different. Still, it also conveys a sense of resilience and therefore hope. But is that hope justified?
Business as usual?
We clearly see a significant drop in the number of vacancies in April. In May, things start to pick up slightly, and by June, it almost looks like 'business as usual'. But not for everyone…
(Semi-) Government
The published vacancies are mostly from (semi-) government organizations and appear to be targeted only at experienced data specialists. Entry-level professionals (in the field) are no longer being sought. We also see no job openings in the 'Marketing Intelligence' domain, for example—a clear sign that the commercial sector in the Netherlands is currently struggling.
What does this mean for the data specialist?
Unfortunately, we are still far from 'business as usual' since we're only at the beginning of the pandemic. The real question is: which sectors and professions will be hit the hardest? How long will it all last? And to what extent will a profession already facing scarcity, like that of the 'data specialist', be affected? Will we soon see experienced data specialists all finding roles within (semi-) government organizations?
All questions we will likely be able to answer more clearly next quarter. We’ll then also see whether the spike in June was simply the result of vacancies being put 'on hold' in April and May. We'll also see whether new opportunities arise for junior data specialists and whether the commercial sector in the Netherlands starts to recover.
Make use of this insight and share the Infographic within your network. Also, follow us on LinkedIn to stay automatically updated on the latest job openings for data specialists and the newest insights and news.
Want to post a job on DataJobs.nl? Click here.
Kind regards,
Raymond te Veldhuis
DataJobs.nl
What did the Q1 Infographic look like again? Download it here.