
A picture is worth a thousand words. That’s why we’re kicking off this year by sharing insights in the form of infographics. Use them to your advantage and share them within your network.
At DataJobs.nl, we guide employers, employees, job seekers, and other interested parties through the world of data vacancies and data specialists. We've been doing this for quite some time through job postings, news, and blogs. But as the saying goes: a picture is worth a thousand words.
That’s why we’re starting this year by sharing insights in the form of infographics.
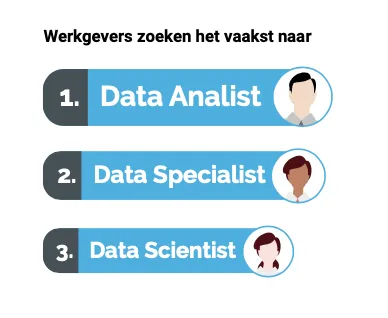
Under this link: Datajobs Infographic Q1 - 2020 you’ll find the very first DataJobs.nl infographic! It highlights the data from the first quarter of this year. We see that DataJobs.nl is mainly used by public sector organizations with 'data analyst/specialist'-type vacancies in the West and Central Netherlands. It also shows the most in-demand technologies and gives us more insight into salary levels.
Take advantage of it and please share the infographic within your network. We’re already looking forward to the next one, because we’re convinced that the data from the second quarter of this exceptional year will look quite different.
Oh, and don’t forget to follow our LinkedIn group. That way, you’ll automatically stay informed about the latest vacancies and the newest news and insights.
Want to post a vacancy on DataJobs.nl? Click here. Would you also like to spotlight your organization as an ‘interesting employer for data specialists’? Then create a Company Data Page together with us.
Raymond te Veldhuis